Data Viewer API Example: Using PowerBI to create interactive visuals
The Landscape Data Viewer API allows you to stream .json data out of Landscape for use in a third party platform. This article walks you through how you might set up and utilize this API with Microsoft PowerBI to create robust, interactive dashboards with real-time data at the push of a button.
PowerBI is a Microsoft product that requires a license from your Global Administrator.
This article is intended as an example of what you can do with a third party app like PowerBI. Please note that assisting with setup in third party apps is beyond the scope of what Landscape support can offer.
How the API works
The Data View API starts with a URL to a saved View in Landscape. A third party service can "call" this URL and then display the results. The results are separated into pages of 100 rows. Each page has an attribute field called continuation which — if not empty — must be appended by the characters &c= to the original API URL to fetch the next page of results, like this:
https://api.example.com/viewdata/q3cpz/gl5307q?apiKey=0dx5d7&c=dgtewj6u7dgub83pzzg2e7j9
The steps below demonstrate how to dynamically perform this action in PowerBI to retrieve every row of a saved View's results in Landscape.
The M expressions below also work in Excel Power Query if you're not using PowerBI!
Step 1: Create a query that loops through the API pages
The first query must create a function that instructs PowerBI to call the base API URL, get its continuation code, and append it to the base API URL in the format shown above. The function must keep doing this until the continuation field is empty. Then it needs to generate a list of all the continuation codes it finds. We will call this the function query.
Here is a sample PowerBI M expression for this function query. Start with a new, blank query and open the Advanced Editor. Remove any text that appears in the Advanced Editor window, then paste this expression:
(initialUrl as text) as list =>
let
    baseUrl = initialUrl,
    TokenList = List.Generate(
        () => [token = "", continue = true],
        each [continue],
        each
            let
                nextUrl = baseUrl & "&c=" & [token],
                Result = try Json.Document(Web.Contents(nextUrl)) otherwise [continuation = "STOP"],
                NextToken = Result[continuation],
                shouldContinue = NextToken <> null and NextToken <> "" and Text.Trim(NextToken) <> "STOP"
            in
                [
                    token = NextToken,
                    continue = shouldContinue
                ],
        each [token]
    ),
    FullTokenList = {""} & TokenList
in
    FullTokenList
The results should look like this:
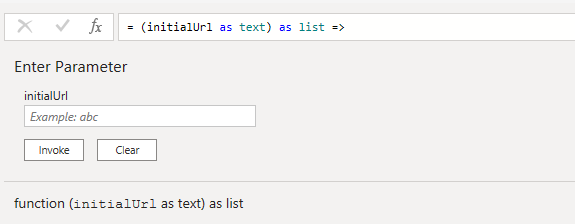
Give your function a name. In this example, we'll call it fnGetBaseApiUrls .
Note that this is NOT where you will enter the base API URL. Your NEXT query is the one that will call this function to assist in generating the data view result list as a table.
Step 2: Create a query that generates a table of results
This second query must start with the base API URL of your saved View, call the function you created in Step 1 to generate a list of continuation codes, loop through each page for the results, and append the results to a table. We will call this the data aggregator query.
In the sample M expression that follows, you will need to replace fnGetBaseApiUrls with the name of your function from Step 1. Start with a new, blank query and open the Advanced Editor. Remove any text that appears in the Advanced Editor window, then paste this expression:
let
baseApiUrl = "ENTER YOUR BASE API URL HERE",
TokenListRaw = fnGetBaseApiUrls(baseApiUrl),
ListofDataTables = List.Transform(TokenListRaw, (token) =>
let
fullUrl = if Text.Trim(token) = ""
then baseApiUrl
else baseApiUrl & "&c=" & token,
Source = Json.Document(Web.Contents(fullUrl)),
DataRecords = Source[results],
ResultTable = if List.Count(DataRecords) > 0
then Table.FromList(DataRecords, Splitter.SplitByNothing(), null, null, ExtraValues.Error)
else #table({"Column1"}, {}),
ExpandedTable = if Table.RowCount(ResultTable) > 0
then Table.ExpandRecordColumn(ResultTable, "Column1", Record.FieldNames(DataRecords{0}))
else ResultTable
in
ExpandedTable
),
FinalCombinedTable = Table.Combine(ListofDataTables),
DataColumns = List.RemoveItems(Table.ColumnNames(FinalCombinedTable), {"Source_Token"}),
DistinctTable = Table.Distinct(FinalCombinedTable, DataColumns)
in
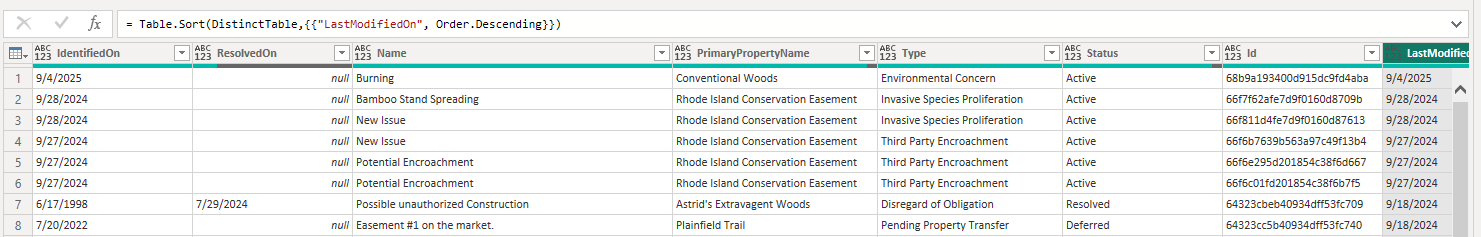
DistinctTable
Your results should be a table containing the same fields that appear in your saved View in Landscape. Check that the number of rows in PowerBI matches the number of results in Data Viewer to ensure the query is returning all results.
Once you Close & Apply the data, you will be able to use these table results to build visuals in PowerBI. Just click 'Refresh' to get all the latest data directly from Landscape!
A few PowerBI reminders:
- Every saved View's API in Landscape is unique. You will need to have a separate data aggregator query for each View that you wish to incorporate into your PowerBI dashboard. You may also want to establish a way of notating which View the API came from, such as giving the query the same name as the View.
- If or when you rotate your API key — a recommended best practice for security — you will need to replace each base API URL in your data aggregator queries.
- PowerBI may pull field values in as Text or No Type. You will need to convert date fields to Date format, and numerical fields to Number formats, to use them meaningfully in your visuals (Query editor > Transform > Data Type).